STATE OF FREIGHT TODAY
Your source for complimentary industry content from FTR
Whether you prefer to read updates, listen to podcasts, or take in the most recent webinar, this page is the source for complimentary FTR content covering everything associated with the commercial freight industry.
When you're ready to learn how FTR can help take you to the next level, download a sample report at the bottom of the page!
Sign up for weekly updates!
Truckstop & FTR Spot Pressure Heat Map
Load Volumes & Spot Rates
Learn more about the TruckStop & FTR U.S. Spot Pressure Heatmap at this knowledgebase article:
https://help.ftrintel.com/knowledge/faq-spot-pressure-heatmaps
Spot Market Insights - February 9, 2026
The spot market remains stressed in the latest week
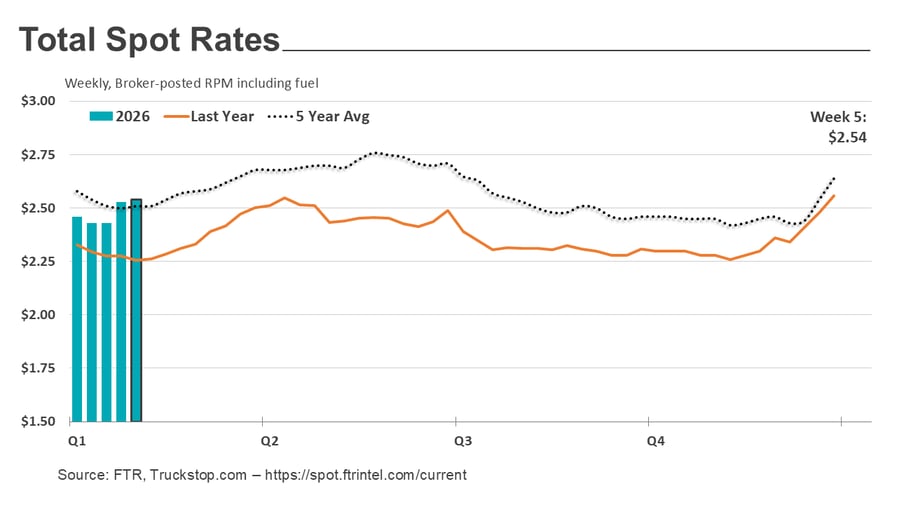
Total broker-posted spot rates in the Truckstop.com system increased slightly during the week ended February 6 (week 5) as dry van and flatbed added to their gains in the previous week and refrigerated spot rates declined only modestly from the record surge in that week. The total market spot rate did not quite match the rate at the end of 2025, but dry van spot rates surpassed year end rates, reaching the highest level since the end of 2022. Flatbed spot rates increased for the 11th time in 12 weeks.
Trucking & Rail Updates from FTR
Updated weekly with downloadable slide decks

Updated weekly on Tuesday, FTR's Avery Vise provides timely updates on key trucking topics moving the market.

Get ahead of 2026 with a clear, data-backed look at the economic, trade, and freight shifts that will shape your strategy.

Updated biweekly on Fridays, FTR's Joseph Towers provides timely updates on rail topics moving the market.
Most Recent Orders & Indices
Class 8 Orders
New class 8 truck orders are normally a leading indicator of the state of the economy. Follow our preliminary order updates to understand the direction of the economy and commercial vehicle production.
Trailer Orders
Strong freight demand dictates the need for new trailers. Follow our preliminary trailer orders to monitor the underlying health of freight and track the demand for new equipment.
Trucking Conditions Index
This exclusive FTR metric combines millions of data points known to influence truck fleet behavior to provide one index measuring the industry's health.
Shippers Conditions Index
This exclusive FTR metric combines millions of transportation data points into one index to help shippers understand rate pressure across the industry.
State of Freight TODAY Articles

Transportation & Economic Update: Limited Data, Meaningful Signals

Rail Traffic, Winter Weather, and What the ARCI Is Telling Us Right Now


.png)